Overview
The ols regression app gives you the ability to run a ordinary least squares regression on a data set. It utilizes the OLS regression library.
Running the Regression
To run a regression, you must select a dataset and select a set of fields to use. Select a dataset in the data drop down box. Then specify a y value (dependent value) in the y value drop down. Next you need to specify one or more x values (independent values). This is down by selecting an x value in the x value drop down and then clicking the add x button. The currently selected x values will be displayed below. To clear the x value, click the clear x button. When you are ready to run the regression, click the regress button.
If you would like to cycle through the available x values, click the regress next button. This will replace the last selected x value with the next avaible value from the dataset, and then run the regression. This allows you quickly cycle through the available regressions to see what is the best fit.
The Regression Report
When you run a regression, the regression report will show up in the center panel.
Charts
Often times, to get a feel of the fit of a regression, it is best to chart various aspects of the fit. After running a regression, the chart options become available. You can run any of the charts by selecting the chart tab, then selecting the type of chart to run in the drop down box, then clicking the chart button.
the first chart you can run is a single variable regression scatter plot with the regression line plotted. For this chart you have to choose the x value to run the regression on in the drop down. (that is, this chart is detached from the actual regression you ran other than having fixed the y value. This is because you have run a multiple regression which cannot be plotted.)
The second chart you can run is a plot of the regression residuals. Lastly, you can run a chart that buckets the residuals into buckets and chart a coloumn chart.
Demo
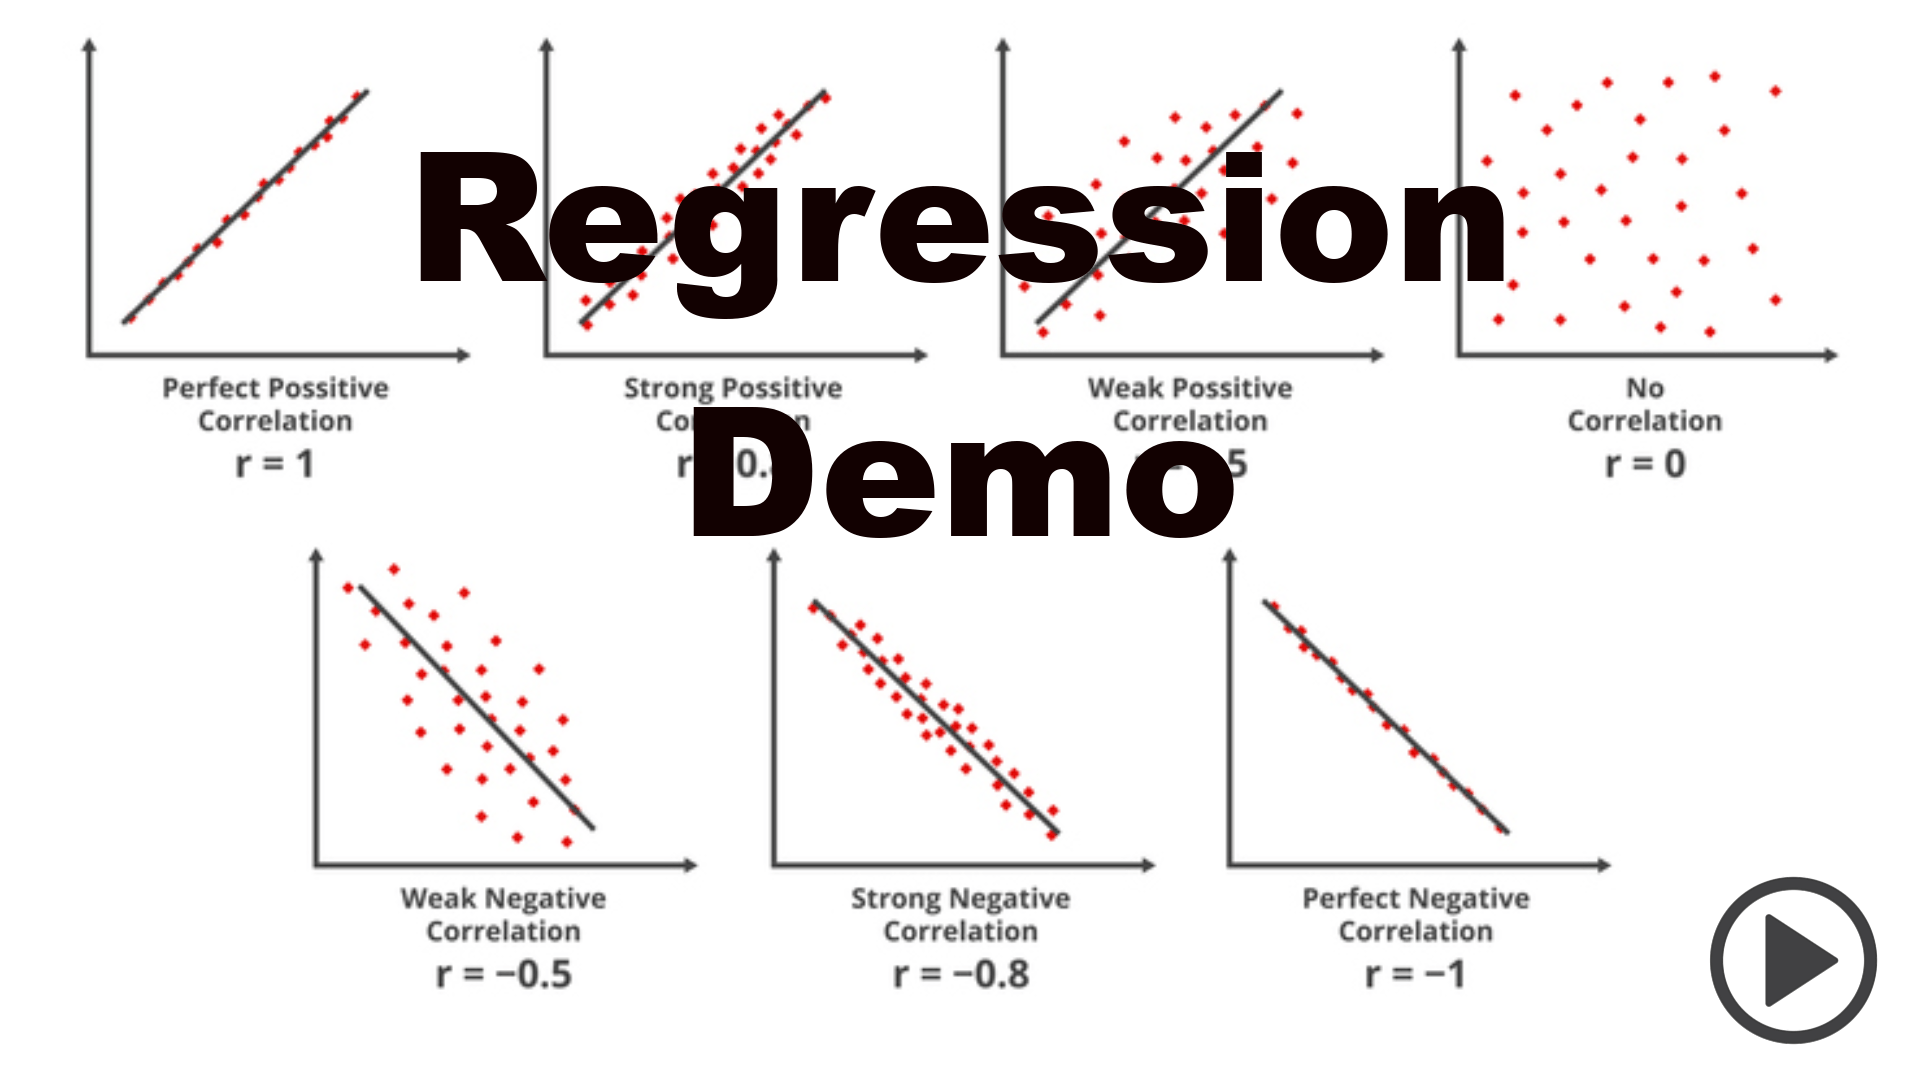
OLS Regression App