Gantt Chart
Overview
The gantt chart allows you to map a project as a series of interrelated tasks.
Adding Tasks
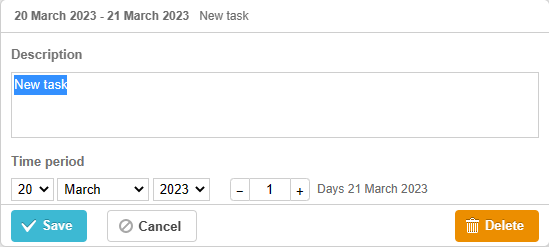
To add a new task, click the blue "plus" button in the top nav bar. This will open a new task dialog window.
Enter a description, and choose the beginning and end dates. Click the save button when finished.
Editing and Deleting Tasks
Once tasks have been added to the chart, you can edit the task by double clicking on the task bar in the chart. This will
re-open the task dialog window, where you can edit the details of the task or delete the task.
Adding Task Dependencies
Tasks that have been added to the chart can have dependencies added to them. Move your mouse cursor near the end of a task. A
small circle will appear. Click on the circle and drag out. This will begin to create an arrow from the selected task. Drag and
drop the arrow onto the circle next to the task you wish to create the dependency on.
Video Demos


